Hari Iyer | SyncEzy
CEO8 Min Read
Nov 03, 2022

There are some powerful reasons why you should use Power BI to create reports from your Simpro data. By accessing your Jobs, Projects, tasks and sub-task data in Power BI, you’ll be able to create powerful reports, graphs, charts and dashboards from your Simpro data.
How do you create reports in Simpro?
To generate Simpro reports, follow the below steps.
To generate a report:
- Go to Reports
 > View Reports.
 - Click the applicable reporting category in the menu to the left.
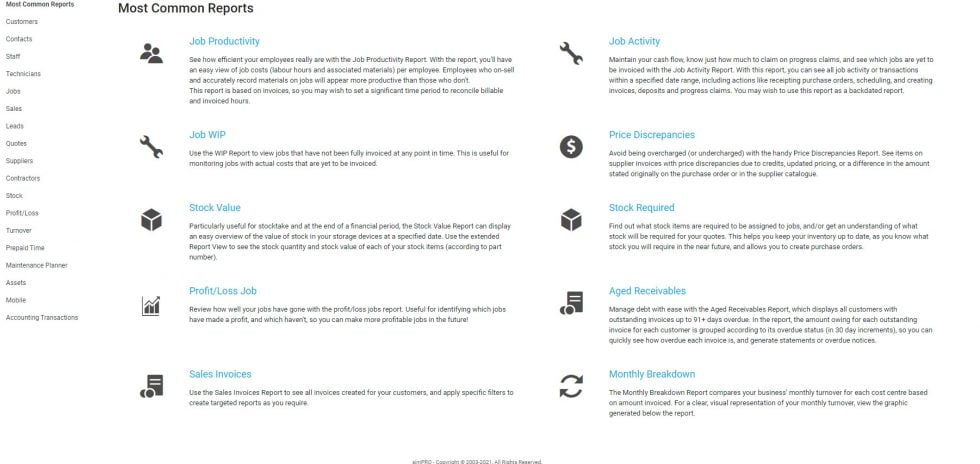
- Alternatively, the report may be one of Simpro‘s Most Common Reports.
- Read the report descriptions to determine if a report is suitable to your needs.
- Click the title of the report you wish to generate.
- Select from the available filters and click Search.
After you have generated the report, you can download it as a spreadsheet in CSV format, viewable in Microsoft Excel and other spreadsheet software.

By using a direct integration with Power BI, you can have a live data feed of information used to power your reports. This saves on downloading and uploading CSV data and using out-dated data in your meetings and reporting.
The Most Common Reports in Simpro include:
- Job Productivity Report
- Job Activity Report
- Job WIP Report
- Price Discrepancies Report
- Stock Value Report
- Stock Required Report
- Profit / Loss Job Report
- Aged Receivables Report
- Sales Invoices Report
- Monthly Breakdown Report
How do you create comprehensive reports from Simpro data?
In order to create more comprehensive reports from your Simpro Jobs, Projects, tasks and sub-task data, you’ll need to use the Simpro to Power BI integration in order to sync Simpro data across to Power BI. This integration will sync across the entire 510 tables of data from Simpro to your Power BI account where you can use the data to build reports like sales per year for every job/quote, jobs by status and the top customers based on number of jobs scheduled.
Once you have the data across into Power BI, you can create reports using the Power BI Service or via their Power BI Desktop app.
How to create Simpro reports in Power BI using their Power BI service
There are several ways to create reports quickly in the Power BI service. Instead of downloading the Power BI Desktop app and importing the data, you can paste data straight into Power BI on the web, and Power BI automatically generates visuals for you.
New to creating in Power BI? Try reading Reports in Power BI for some quick background information.
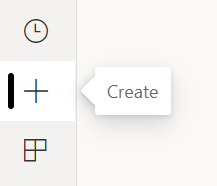
In the navigation pane in the Power BI service, you can select the Create button that opens a page where you can select your data source. It’s also accessible from the New report button on Home.
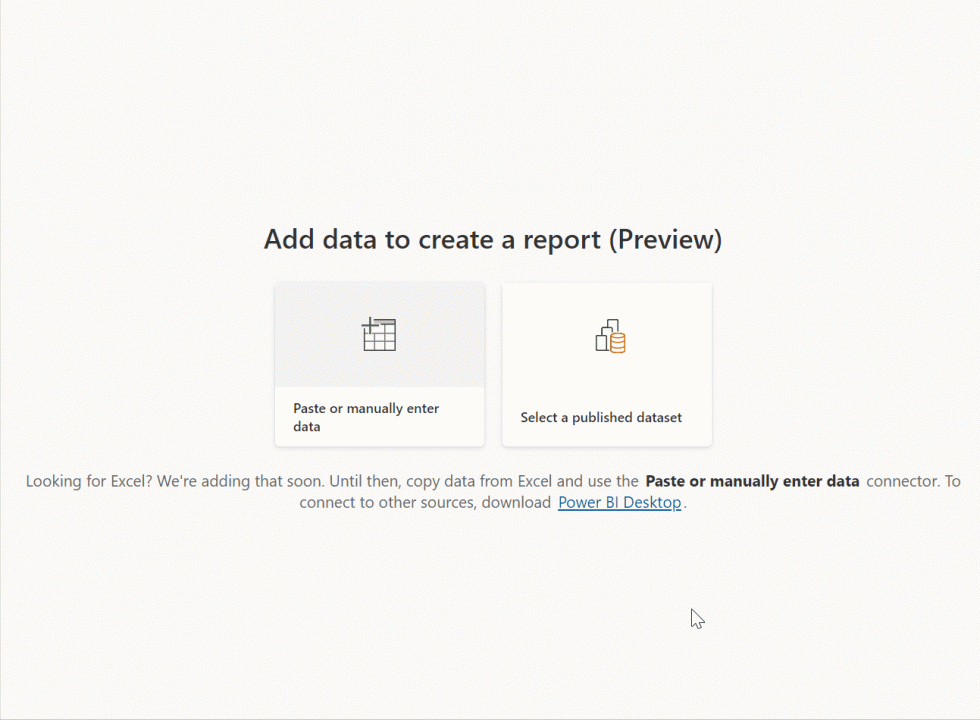
Currently, we only support creating a report based on an existing dataset, or pasting or manually entering data directly in a table. Over time you’ll see other sources, such as uploading an Excel file.
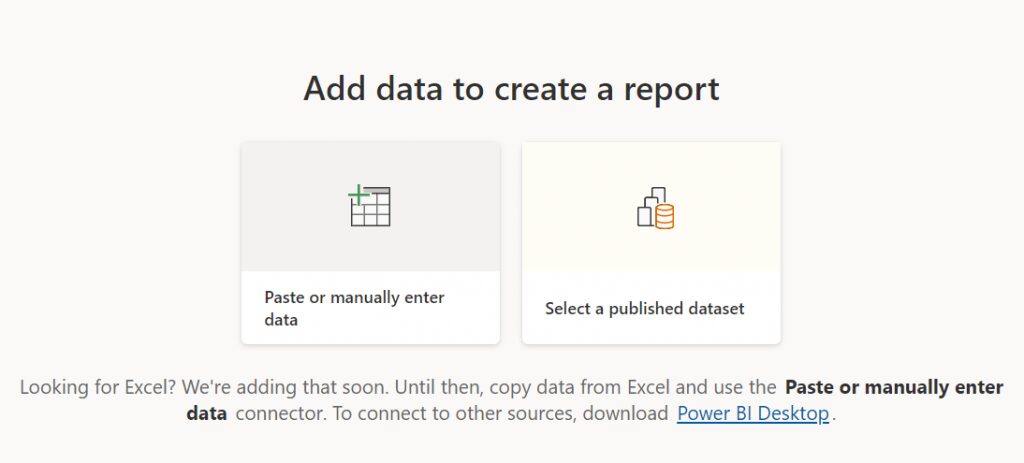
When you choose to paste or manually enter data, you get a grid that you can start to type into. You can also paste data by using Ctrl + V or the context menu.
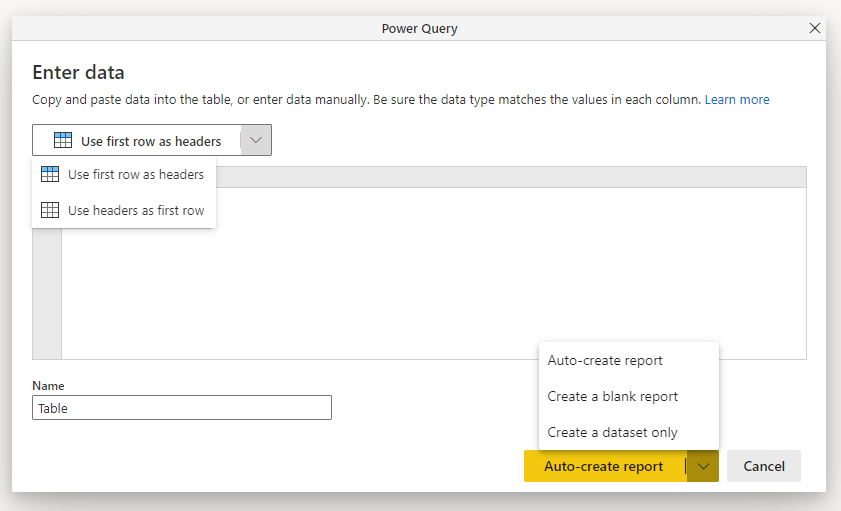
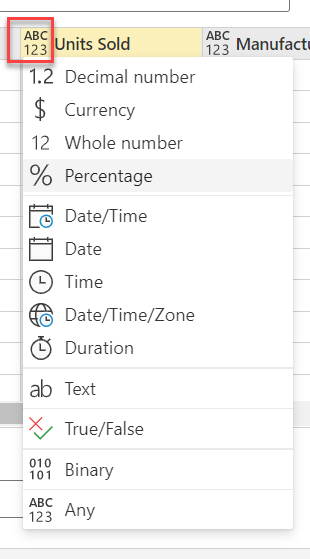
You can use the context menu to add and remove columns. If your pasted data includes a header row, select Use first row as headers to automatically promote the first row to the header row. Power BI automatically detects the data types, but you have the option to set them manually. Select the Data type button next to the column name.
As you go through the creation process, Power BI creates a new dataset for you, and autogenerates a summarized view of your data. These autogenerated visuals propel you from raw data to insights faster than ever.
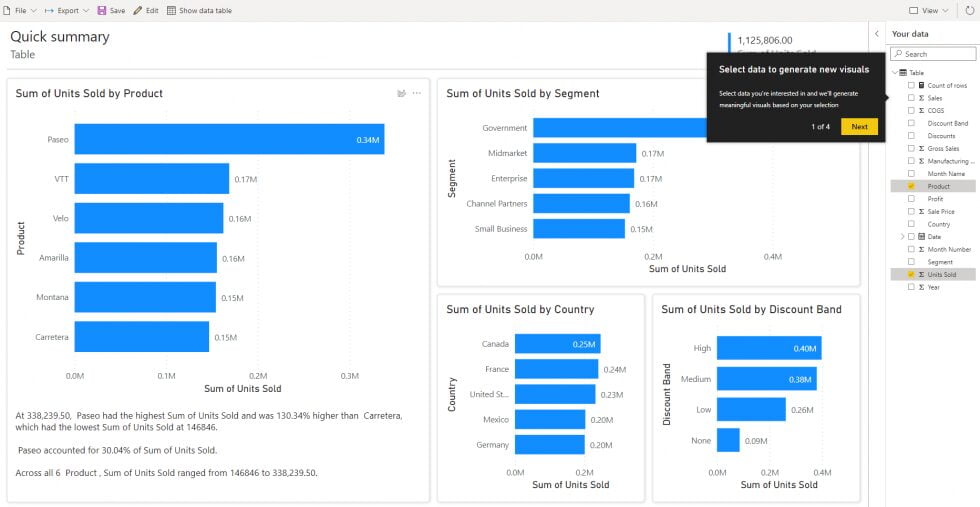
Changing the data you see in the report is easy, too. Use the Your data pane to add or remove fields from the report. Select and deselect fields to update what you want to measure and analyze. Power BI automatically plots meaningful charts based on your field selection. Read Interact with autogenerated “quick” reports to see all the ways you explore and modify these reports.
Switch to full edit experience
If you want to switch to a full edit experience, select the Edit button in the menu bar. Be aware though, that once you save the report in the full edit experience, you can’t go back to the quick edit view.

Looking to create reports from Simpro data on your desktop?
How to create Simpro reports in Power BI using their Power BI Report Server
You can store and manage Power BI reports on premises in the Power BI Report Server web portal, just as you can store Power BI reports in the cloud in the Power BI service. You create and edit reports in Power BI Desktop, and publish them to the web portal. Then report readers in your organisation can view them in a browser or in a Power BI mobile app on a mobile device.
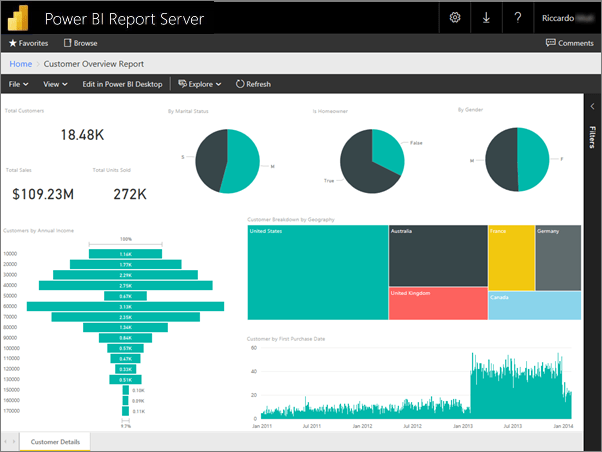
Here are four quick steps to get you started.
Step 1: Install Power BI Desktop for Power BI Report Server
If you’ve already created Power BI reports in Power BI Desktop, then you’re almost ready to create Power BI reports for Power BI Report Server. We recommend installing the version of Power BI Desktop for Power BI Report Server so you know the server and the app are always in sync. You can have both versions of Power BI Desktop on the same computer.
- In the report server web portal, select the Download arrow > Power BI Desktop.
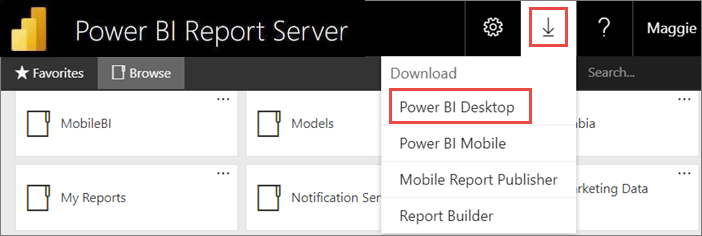 Or go to the Power BI Report Server home page and select Advanced download options.
 - In the Download Center page, select Download.
- Depending on your computer, select:
- PBIDesktopRS.msi (the 32-bit version) or
- PBIDesktopRS_x64.msi (the 64-bit version).
- After you download the installer, run the Power BI Desktop Setup Wizard.
- At the end of the installation, check Start Power BI Desktop now.It starts automatically and you’re ready to go. You can tell you have the right version because Power BI Desktop (January 2021) is in the title bar.
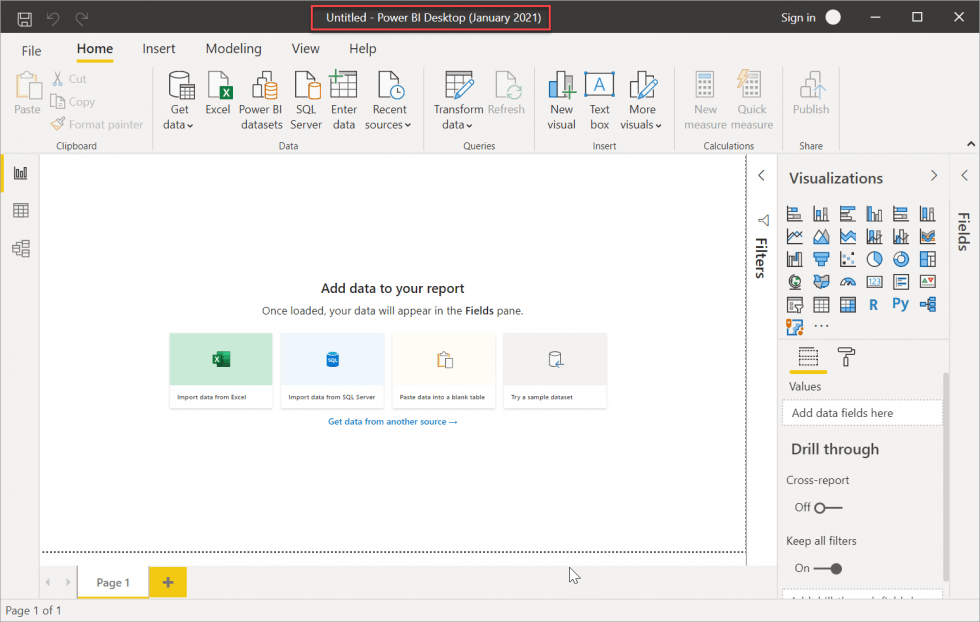
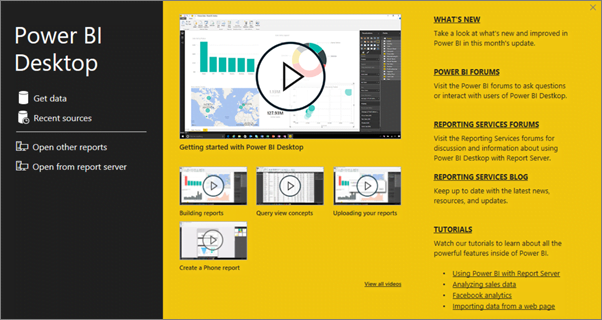
- If you’re not familiar with Power BI Desktop, consider watching the videos on the welcome screen.
Step 2: Select a data source
You can connect to a variety of data sources. Read more about connecting to data sources.
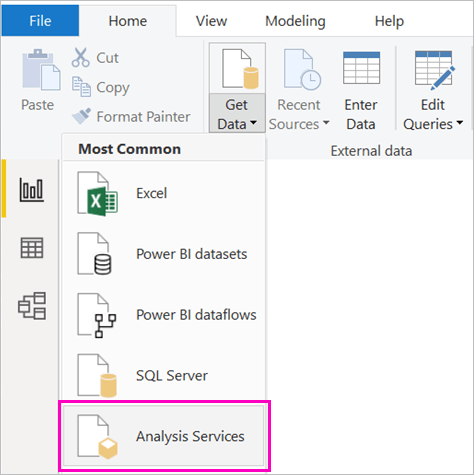
- From the welcome screen, select Get Data.Or on the Home tab, select Get Data.
- Select your data source — in this example, Analysis Services.
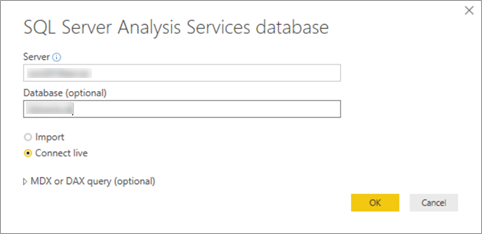
- Fill in Server, and optionally, Database. Make sure Connect live is selected > OK.
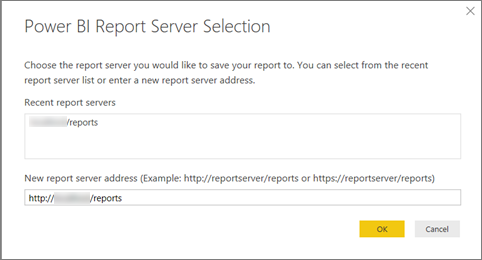
- Choose the report server where you’ll save your reports.
Step 3: Design your report
Here’s the fun part: You get to create visuals that illustrate your data.
For example, you could create a funnel chart of customers and group values by yearly income.
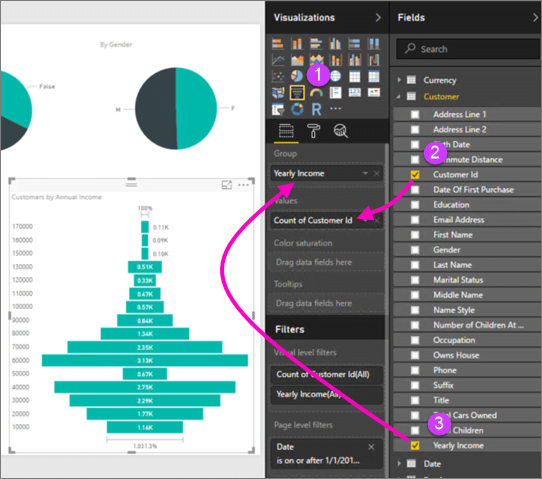
- In Visualizations, select Funnel chart.
- Drag the field to be counted to the Values well. If it’s not a numeric field, Power BI Desktop automatically makes it a Count of the value.
- Drag the field to group on to the Group well.
Note: Some visuals such as paginated report visual will only work on the Power BI service only. Rendering these visuals on Power BI Report Server will give an “Unsupported visual” error.
Step 4: Save your report to the report server
When your report is ready, you save it to the Power BI Report Server you chose in Step 2.
- On the File menu, select Save as > Power BI Report Server.
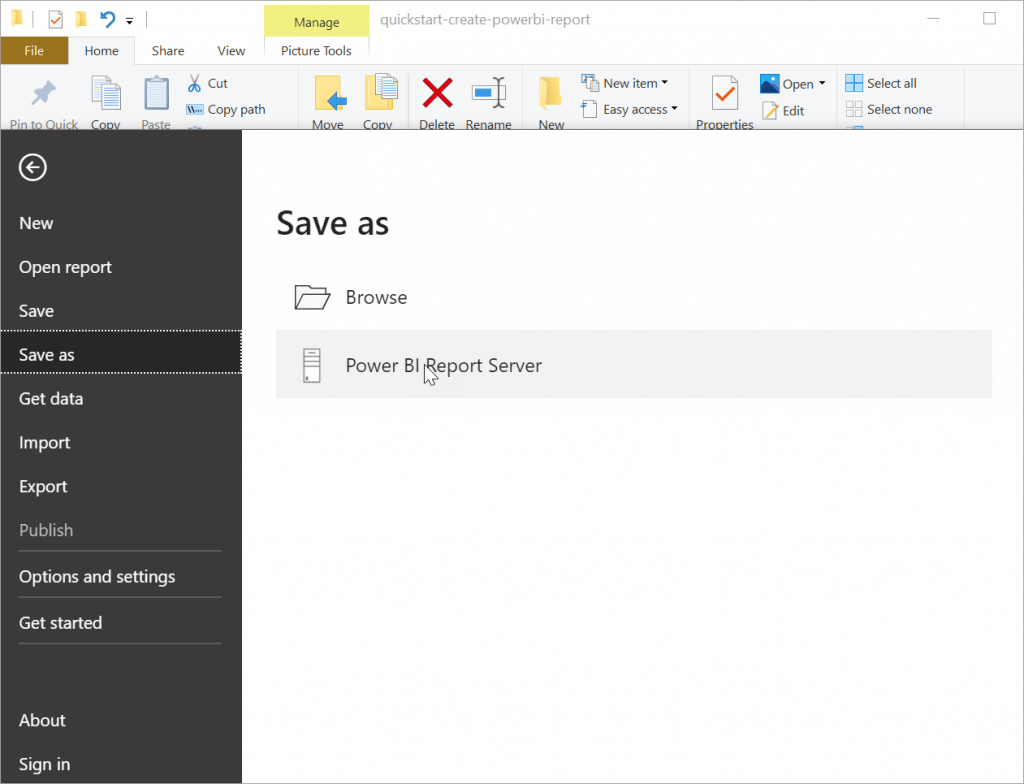
- Now you can view it in the web portal.

Note: If you choose to edit the report in the future, the report data you see in the desktop will always be the cached data from when the report was initially created. To view the latest data when editing the report, you must refresh the data in your Power BI Desktop application.
Got questions about Simpro reporting & dashboards?
If you’re looking for a more robust solution than Simpro’s in-built reporting, speak to our integration specialists about how connecting Simpro to Power BI can help you see your business data in a more comprehensive way.
