Hari Iyer | SyncEzy
CEO5 Min Read
May 18, 2020

Introduction
Business reporting and analytics dashboards are the need of the hour. To get all business information and data from different sources consolidated into a single place and generate reports and analytics is exactly what our next integration helps with.
simPRO Power BI integration allows PowerBI to connect to all of your simPRO data and helps to provide a very powerful reporting platform for your business.
simPRO by itself is a very comprehensive and detailed platform. It can serve your business requirements quite well whether you wish to schedule jobs, contact customers, raise customised invoices and so on.
On its own, simPRO has its own advanced report builder, but this integration goes beyond what’s possible there as it allows you to extract and connect to the entire 510 tables of data in simPRO. PowerBI as a data platform could already connect to other sources like Xero and Google Analytics and it can now connect to simPRO.
Enter Power BI
Power BI is one of the best reporting tools out there. Power BI relies on data sources that come from external sources. Power BI on its own cannot achieve what simPRO can. But when simPRO and Power BI are integrated together, they can create some unique magic.
Here’s what we can extract once simPRO is connected to Power BI.
1. Connecting the Database
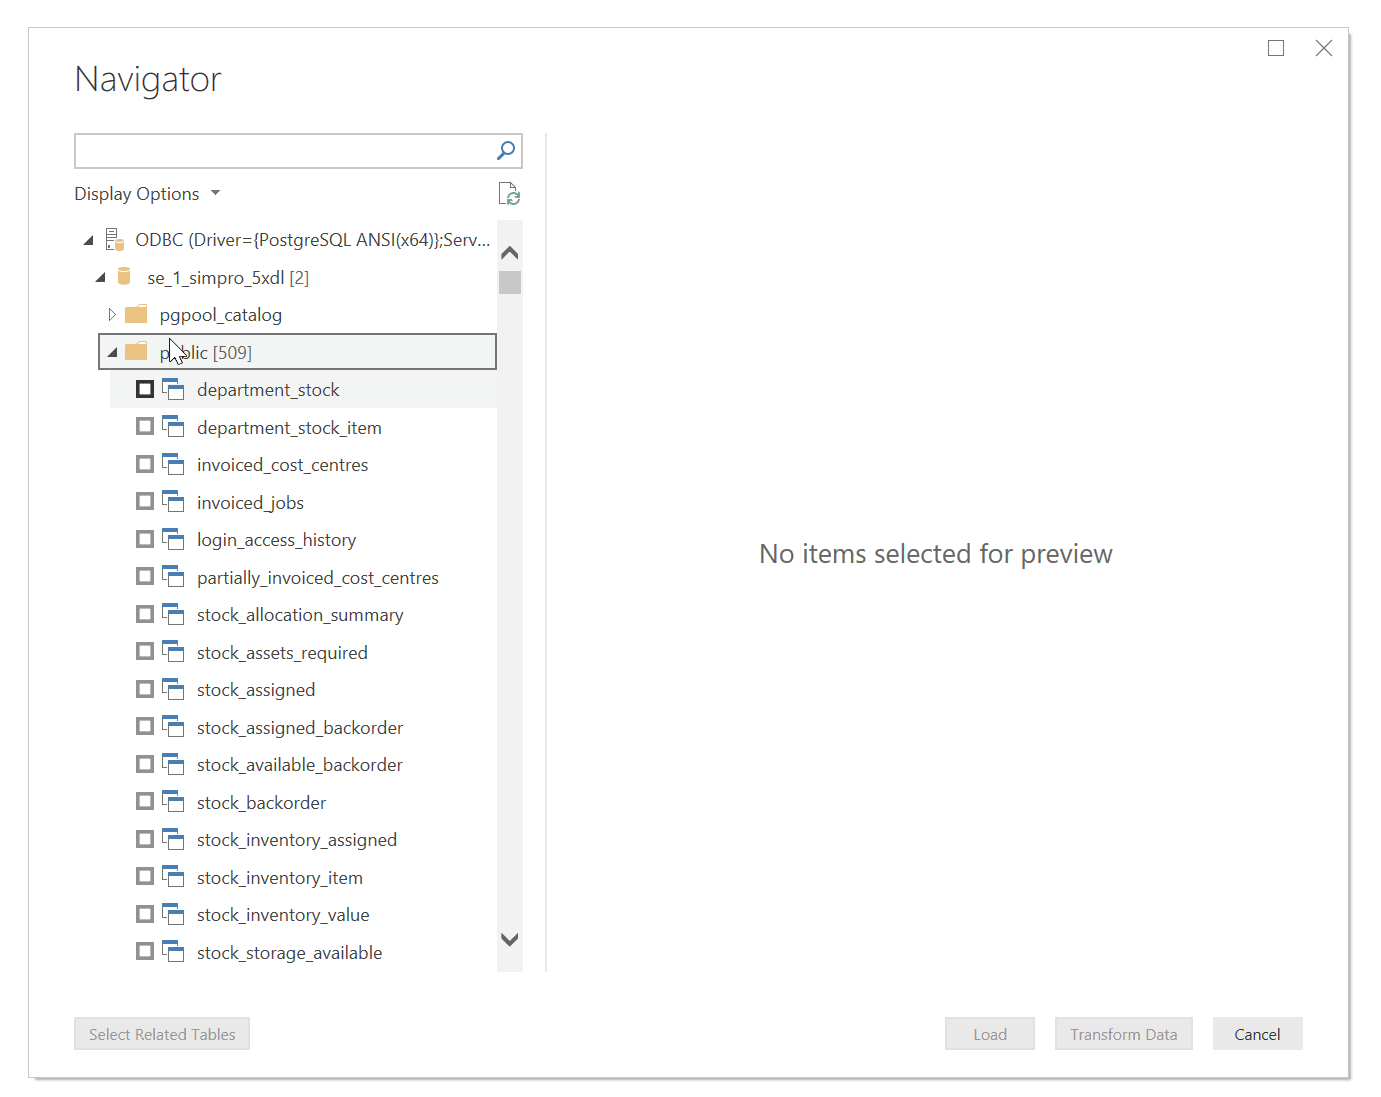
simPRO has a database of information which stores all your records such as Jobs, Quotes, Customers and so on. We already use this information in some of our more popular integrations such as simPRO to Zoho CRM.
So the first thing that needs to be done is connecting this database and cleaning it up. We also do relational data modelling and cleanups so that we can remove any junk/irrelevant information and bring out the best reports.
This gives you access to the entire 510 tables of data. Think of it as simPRO Stripped bare without any User Interface. This is all the available simPRO data that includes all the modules and tiny little areas that you currently can’t report on in report builder or in standard simPRO UI.
2. Creating Reports
Now that the data has been cleaned up and organised, it is time to make reports that will help you analyze your business. These reports can vary according to your business needs. In general, we provide templates of reports which we think customers will find the most useful. But more specific reports can also be created on request.
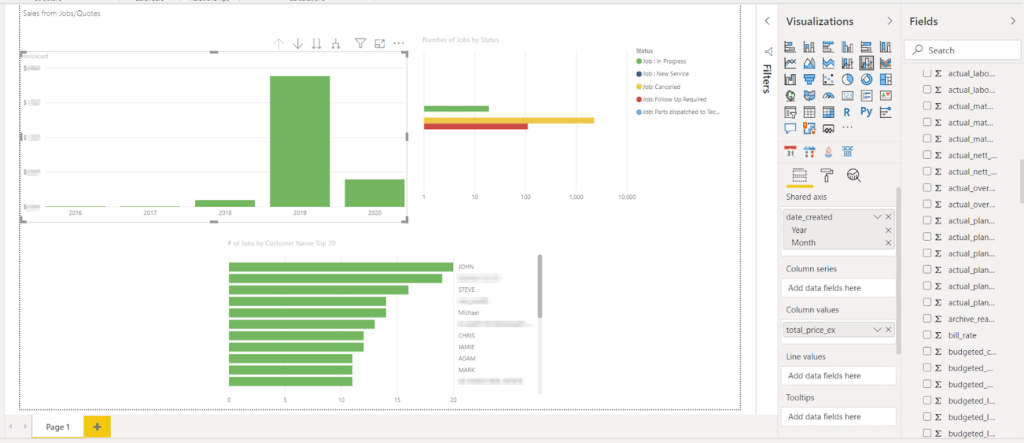
In this example, we are creating three visuals in a report. The data in this report contains three visuals: Sales by Year for every Job/Quote, Jobs by Status and the top customers based on the number of Jobs scheduled with them.
3. Publishing Reports
Let us consider the report we just created. After we have finished creating the relevant visuals, we are now ready to publish the report. Reports can be published publicly or within a dedicated Power BI workspace.
When you open a report, you will have an overview of the data that has been inserted. For example, we can see the total sales in 2019 or the total number of jobs from a customer. It is also possible to “drill down” and see more of the report.
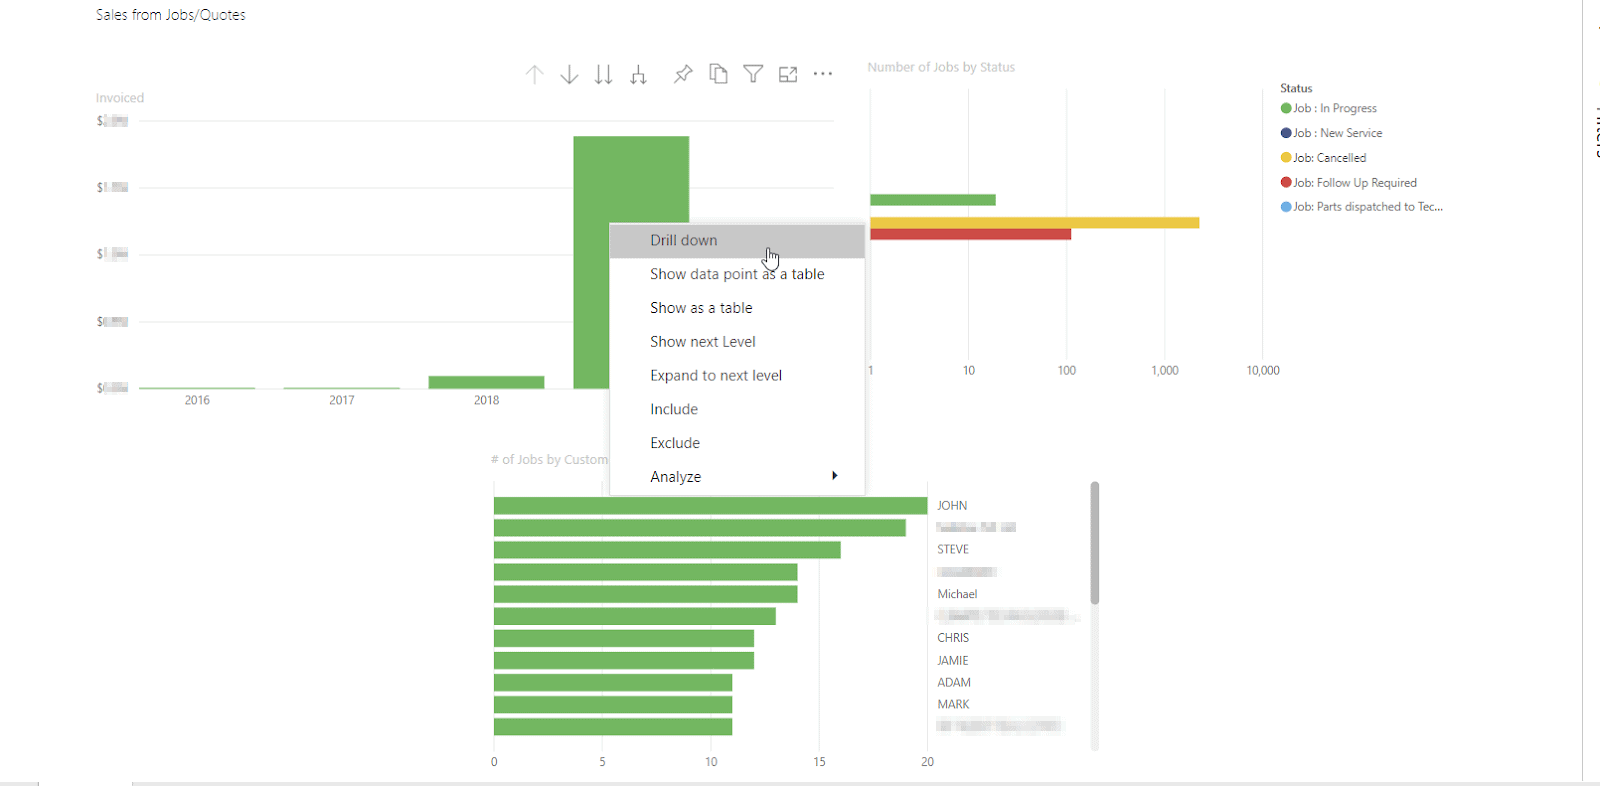
Taking the above example, just right-click a point in the report and select “drill down”. This will allow you to view more details. We are currently drilling down in the 2019 sales figure to see the sales by month.
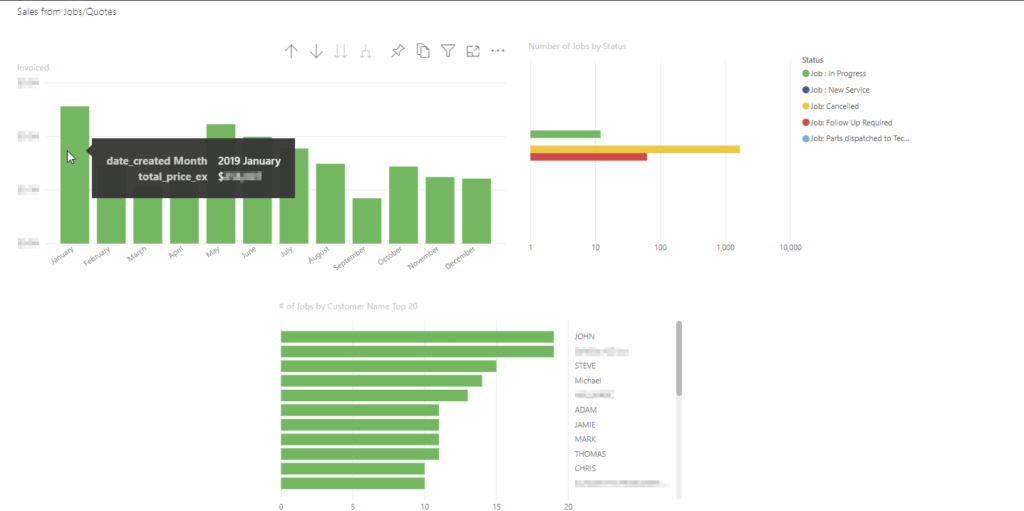
When we do this the report will change synchronously with the other reports. This is the default behaviour of the report but we can always prevent this from happening if you don’t like it that way.
Hovering over January, we can see the total amount of sales made for the month.
Conclusion
In conclusion, Power BI supercharges your simPRO data to visualise and analyse data from your business. Whether you want to see your sales, location-based jobs, customer feedback or anything else from the plethora of data from your simPRO Account, Power BI will help you by offering new perspectives.
Business Intelligence and Analytics is a very useful practice to understand the performance of your business. You can visualise shortfalls, successes and failures in a manner that is friendly to read and understand.
If you are interested in this integration or if you have any queries, get in touch with SyncEzy and we will be happy to assist you.
Warning:
Creation of reports here requires proficiency in PowerBI, this is a very strong enterprise-grade Dashboarding and BI tool so it does come with a certain level of complexity. We provide you with some basic reports to start with and you can build on top of this. Or alternatively, hire an external Data Analyst or PowerBI Consultant to help with building the reports.
While we don’t build the reports for you we can recommend you our contacts who are experts in PowerBI.
There is a lot of data in simPRO and getting it in this raw form might be overwhelming if you are not used to handling large datasets. This is not a job for someone weak at data.
If you are a nerd and proud of it or you have nerds who can get through the technical barriers for you, this integration provides you with an unprecedented level of data from within simPRO.
